Scary equity valuations - is it different this time?

This article is for Australian Wholesale and Professional investors only. Nothing in this article constitutes an offer, invitation or recommendation to acquire or dispose of any financial product.
Introduction: Back to First Principles
Every so often, finance needs to put the spreadsheets down, stop arguing about decimal points, and go back to first principles.
At its core, investing is (relatively) simple. You are paying today for a stream of future cash flows. The price you pay should reflect three things:
1. How large are those cash flows
2. How durable they are
3. How risky they are
Everything else is just a more sophisticated way of dressing that up.
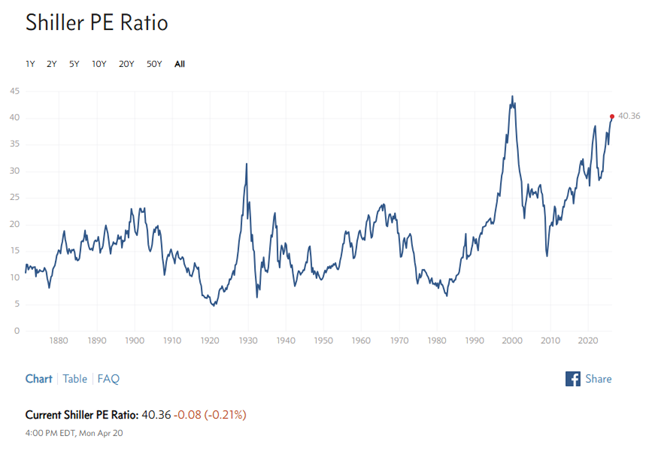
I bring this up in light of the current market debate over whether equities are expensive. One indicator I see discussed a lot in this context is the Cyclically Adjusted Price-to-Earnings ratio, or CAPE, popularised by Robert Shiller. CAPE asks a very sensible question: Are we paying too much for earnings relative to history?
Right now (in April 2026), particularly for the S&P 500, CAPE’s answer is: Yes!
And yet, markets seem remarkably unbothered.
So, either investors have collectively abandoned discipline… or the underlying structure of markets and the earnings they produce have changed in ways that CAPE doesn’t fully capture.
I’m going to dig further into the second possibility to shed light on the myriad of indicators used to assess markets. My takeaway is that it is more important to understand what these indicators represent (or at least try to) and to look past the oft-repeated single number on a screen. I’m encouraging you to challenge the headline and tease out the nuance in the numbers. Make more informed decisions.
See the headlines for what they generally are – sensationalised statements (good or bad) designed to attract your attention.
The 1980s: When the System Was Rewired
To understand today’s valuation debate, you need to go back to the 1980s—not for nostalgia, but because that’s when the rules of the game changed.
The policy shifts associated with the governments of Margaret Thatcher and Ronald Reagan weren’t just ideological—they were structural:
• Deregulation of financial markets
• Liberalisation of capital flows
• Privatisation of state-owned assets
• A broader shift toward market-based capital allocation
At the same time, the inflation regime was decisively broken (with some help from Paul Volcker), setting the stage for lower discount rates and a multi-decade tailwind for asset prices.
But beyond the macroeconomics, something deeper was happening.
The structure of industries began to evolve, and by association, so did the listed market indices.
Market Structure: From Fragmentation to Dominance
I think it’s reasonable to say that the typical industry of the 1970s and early 1980s was:
• Fragmented
• National in scope
• Capital-intensive
• Labour heavy
While today, many industries look very different:
• Consolidated or oligopolistic
• Globally scalable
• Increasingly intangible (brands, IP, etc.)
• Reinforced by network effects
This evolution matters because market structure drives margins.
Fragmented industries compete profits away.
Concentrated industries protect them.
Over time, developed markets have seen a steady increase in sectoral concentration. The result is a structural lift in equilibrium profitability—not just cyclical peaks, but higher average margins.
Margins directly impact the denominator of the CAPE.
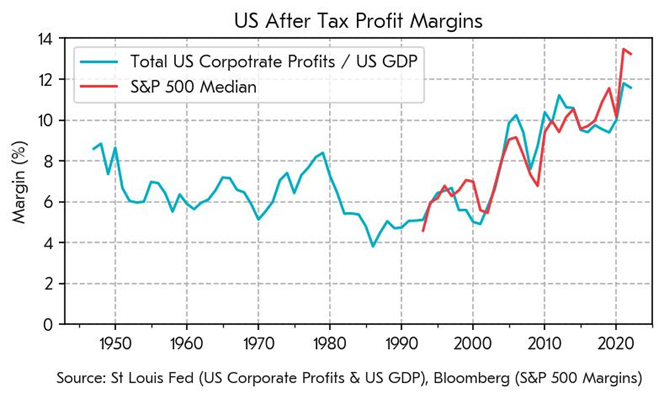
If you start from first principles, paying for future cash flows, this matters enormously. More durable margins mean more reliable earnings. More reliable earnings justify higher valuations.
CAPE, however, still carries the DNA of a lower-margin, more competitive world.
A Brief Detour: Wasn’t Concentration Already High in the 1980s?
At this point, a fair pushback might be: “Hang on—wasn’t market concentration already high in the early 1980s?”
This is a good question. On the surface, the data can make it look that way. Measures like the Herfindahl-Hirschman Index (HHI) do show elevated levels of concentration in certain parts of the economy around that time.

But this is one of those moments where the data is technically correct… yet I would say, economically misleading.
Because the nature of concentration in the early 1980s was fundamentally different to what we see today.
First, much of the data from that period is heavily skewed toward manufacturing industries, which were inherently more concentrated. Define industries narrowly enough—say, “automobile manufacturing”—and you’ll always find a handful of dominant players, due to scale benefits.
Second, concentration was often policy-driven rather than market-driven. Entire sectors operated as regulated oligopolies or monopolies. The most obvious example is AT&T, which effectively controlled US telecommunications before its breakup in 1984. Utilities, airlines (pre-deregulation), and banking exhibited similar traits.
This wasn’t winner-takes-most capitalism. It was structured this way purposely.
Third, markets were far more domestically bound. Globalisation had not yet fully taken hold, so firms competed within national borders—fewer competitors, higher measured concentration.
So yes, concentration could look high in 1982—but it was generally:
• Industrial
• Capital-intensive
• Regulation-supported
• Geographically constrained
Today’s concentration is mostly:
• Platform-driven
• Asset-light
• Network-effect reinforced
• Globally scalable
Same metric. Completely different economics.
And crucially, modern concentration tends to enhance margins, whereas earlier concentration often came with regulatory constraints that capped profitability.
Capital-Light Business Models: Less Steel, More Scale
If market structure explains why margins have improved, business models explain how.
In the 1980s, growth required capital:
• Build factories
• Hire labour
• Hold inventory
• Expand physically
Returns were tethered to the capital base.
Today, many of the largest companies in developed markets grow by deploying:
• Code
• Data
• Platforms
• Intellectual property
The marginal cost of adding another customer is often negligible.
This shift to capital-light models has two powerful effects:
• Higher return on capital
• Faster scalability of earnings
From a first principles perspective, you are buying a better machine—one that produces more cash with less input.
It would be surprising if that machine traded at the same valuation as its 1980s equivalent.
Software: The Quiet Margin Expansion Engine
Software isn’t just another sector—it’s a general-purpose technology that has quietly rewritten the economics of entire industries.
Across the board, software has:
• Automated labour
• Optimised supply chains
• Enabled dynamic pricing
• Reduced operational friction
• Improved customer acquisition and retention
Even companies that don’t “look” like tech firms are now deeply software-enabled. Look at infrastructure owners with digital twins, logistics, etc., the list goes on.
The result is a broad-based uplift in:
• Efficiency
• Margins
• Earnings stability
This is not cyclical. It is structural.
And yet, CAPE treats these improved earnings as if they are directly comparable to those generated in a pre-software world.
Outsourcing: Cleaner Earnings, Better Businesses
Layer on top the effects of globalisation.
Developed market companies have increasingly outsourced:
• Manufacturing
• Labour-intensive processes
• Capital-heavy production
While retaining:
• Brand
• IP
• Distribution
• Customer relationships
The messy, margin-compressing parts of the business have been externalised.
What remains is a cleaner, higher-quality earnings stream.
Again, from a valuation perspective, this should command a premium.
Regulation: More Bark, Less Bite
If market structure has shifted toward greater concentration, the obvious follow-up is: where were the regulators?
The answer is not that they disappeared—it’s that the framework they were operating under changed.
From the 1980s onward, competition policy—particularly in the US—increasingly aligned with the consumer welfare standard, heavily influenced by thinkers like Robert Bork. In simple terms, regulators focused less on market structure (i.e. concentration) and more on outcomes, primarily:
• Prices to consumers
• Short-term efficiency gains
If prices were stable or falling, and in many cases, they were, thanks to globalisation and technology, then higher concentration attracted less scrutiny.
This had a few important consequences:
• Mergers were more readily approved, particularly where cost synergies could be demonstrated
• Market power became harder to prosecute, especially in industries where services were nominally “free” (think digital platforms)
• Dynamic competition arguments (“they’re only dominant until the next disruptor arrives”) were given more weight.
This ultimately led to more concentrated industries, with increased scale and hence greater profitability.
Mean Reversion to What?
Which brings us back to the CAPE and its central premise: mean reversion.
Historically, valuations revert to a long-term average.
But if:
• Margins are structurally higher
• Business models are more efficient
• Market structures are more supportive
• Technology has improved profitability
Then the mean itself may have shifted.
In that world, markets may still revert—but to a higher equilibrium level, not the historical average embedded in the CAPE.
The Counterpoint (Because It Would Be Suspicious Without One)
Of course, none of this means markets are immune to overvaluation.
Higher-quality earnings don’t justify:
• Unlimited multiples
• Overly optimistic growth assumptions
• Ignoring competitive or regulatory risks
Margins can compress.
Disruption can happen. (Does AI eat software?)
Regulators can intervene (Woolworths and Coles)
The CAPE remains useful precisely because it forces you to ask uncomfortable questions.
It just doesn’t answer them on its own.
Back to First Principles (Again)
The CAPE says markets are expensive.
Markets say the world has changed.
The truth, as usual, sits somewhere in between.
If we return to first principles:
• Today’s cash flows are higher
• They are often more durable
• They require less capital
• Competition structures support them
That should justify a higher valuation multiple.
But first principles also demand discipline—the price you pay still matters.
So rather than treating the CAPE as a verdict, it’s better viewed as a signal—one input into a broader assessment of markets. Ultimately, valuation is not about whether something is expensive relative to the past.
It’s about whether the price you pay today is justified by the future that lies ahead.
And if the future is being driven by capital-light, software-enabled, globally dominant firms with structurally higher margins…
Then perhaps “expensive” isn’t quite what it used to be.
Conclusion
If nothing else, this exercise should make you a little more suspicious of any headline built around a single number.
Indicators like CAPE are useful, often very useful, but they are only ever a lens. And like any lens, what you see depends on the assumptions embedded in it, and the world it was designed to measure.
I continue to use CAPE as a broad gauge of market valuation. But I’m increasingly of the view that the “mean” it points to is not a fixed 100-year anchor, but something more fluid—shaped by changes in market structure, business models, and the nature of earnings themselves.
I encourage you to dig a little deeper and challenge single headline numbers. Truly understanding how the numbers are derived and how they have evolved. This knowledge can be a powerful antidote to the daily barrage of financial headlines and help you make more informed decisions.
Disclaimer
This article is intended for wholesale investors as defined under the Corporations Act 2001 (Cth) and is not intended for retail investors. The information provided herein is for general informational purposes only and does not constitute financial, investment, or professional advice.
The views expressed in this article are those of the author and do not necessarily reflect the official policy or position of Kings Gate Capital Partners. While every effort has been made to ensure the accuracy of the information, Kings Gate Capital Partners makes no representations or warranties, express or implied, as to the completeness, accuracy, reliability, suitability, or availability of the information contained in this article. Any reliance you place on such information is therefore strictly at your own risk.
Investing involves risk, including the potential loss of principal. Past performance is not indicative of future results. Before making any investment decision, you should seek independent financial, legal, and tax advice tailored to your specific circumstances.
This article may contain forward-looking statements that are subject to risks and uncertainties. Actual results may differ materially from those expressed or implied in such statements. Kings Gate Capital Partners disclaims any obligation to update or revise any forward-looking statements to reflect new information or future events.
For more detailed information contact us directly.